

A Mac can feel slow for several reasons, and the cause is not always obvious from the desktop. An app may be using too much processor power. A browser tab may be consuming memory. A background process may be writing large amounts of data to disk. A cloud service may be syncing files. A video call may be draining battery faster than expected. Activity Monitor is the built-in macOS tool that shows those details in one place.
The app has been part of the Mac for years, but it is often ignored until something goes wrong. That is a missed opportunity. Activity Monitor is not only a utility for troubleshooting frozen apps. It is a dashboard for understanding how macOS is using the processor, memory, energy, disk, and network. It can reveal which apps are demanding the most resources, which processes are active in the background, and whether the system is under pressure.
Its value is not that every Mac owner needs to read technical data all day. Most people do not. Activity Monitor is useful because it answers specific questions quickly. Why is the fan running? Why is the battery dropping? Why did the Mac become slow after opening a project? Why is a browser using so much memory? Why is the network active when no download appears to be running?
The answers are rarely perfect on the first glance, but Activity Monitor gives a starting point. It turns a vague feeling that “the Mac is slow” into something measurable.
Finding Activity Monitor
Activity Monitor is stored in the Utilities folder inside Applications, but Spotlight is usually the fastest way to open it. Once open, the app shows a table of processes and several tabs across the top of the window. The main views are CPU, Memory, Energy, Disk, and Network. Some Macs may also show Cache if content caching is turned on.
To open Activity Monitor with Spotlight:
Command + Space > Type Activity Monitor > Return
To open Activity Monitor from Finder:
Finder > Applications > Utilities > Activity Monitor
Each tab changes the meaning of the list. CPU shows processor use. Memory shows RAM pressure and how much memory apps are consuming. Energy shows which apps are affecting power use. Disk shows data read and written. Network shows data sent and received. The same app can look harmless in one tab and demanding in another, depending on what it is doing.
A web browser is a good example. It may use moderate CPU while sitting idle, high memory with many tabs open, high energy during a video call, disk activity while downloading, and network activity while streaming. Activity Monitor separates those behaviors instead of reducing performance to one vague number.


The CPU Tab Explains Slowdowns and Heat
The CPU tab is the first place to look when a Mac feels busy, hot, or unusually slow. It shows how much processor capacity each app or process is using. Apple’s guide explains the CPU view as a way to see current and recent processor activity, including percentages for System, User, and Idle at the bottom of the window.
System represents CPU activity used by macOS processes. User represents CPU activity from apps opened by the user or processes connected to those apps. Idle shows available processor capacity. A Mac does not need to be at 0% CPU to be healthy. Modern systems are constantly doing background work. The useful question is whether one app or process is consuming a large share for a long time.
A short burst is normal. Opening Photos, exporting video, indexing files, compiling code, loading a game, running a browser with many tabs, or using AI and creative apps can push CPU usage higher. That does not automatically indicate a problem. Sustained high CPU becomes more relevant when the Mac slows down, battery life drops, fans run loudly on Intel models, or a process appears stuck.
Activity Monitor also lets CPU activity appear in the Dock, which can be useful during troubleshooting.
To show CPU activity in the Dock:
Activity Monitor > View > Dock Icon > Show CPU Usage
To view current CPU usage in a separate window:
Activity Monitor > Window > CPU Usage
To view recent CPU history:
Activity Monitor > Window > CPU History
The CPU tab can also help identify apps that need attention. If an app stays near the top of the list without an obvious reason, quitting and reopening it may help. If the behavior returns, the app may need an update, a settings change, or a deeper look at what it is doing.
Force quitting from Activity Monitor should be used carefully. Some processes belong to macOS, and quitting them can cause instability, logouts, or immediate relaunches. Force quitting is more appropriate for an app that is frozen, unresponsive, or clearly misbehaving.
To quit an app or process in Activity Monitor:
Activity Monitor > Select the app or process > Stop button > Quit or Force Quit
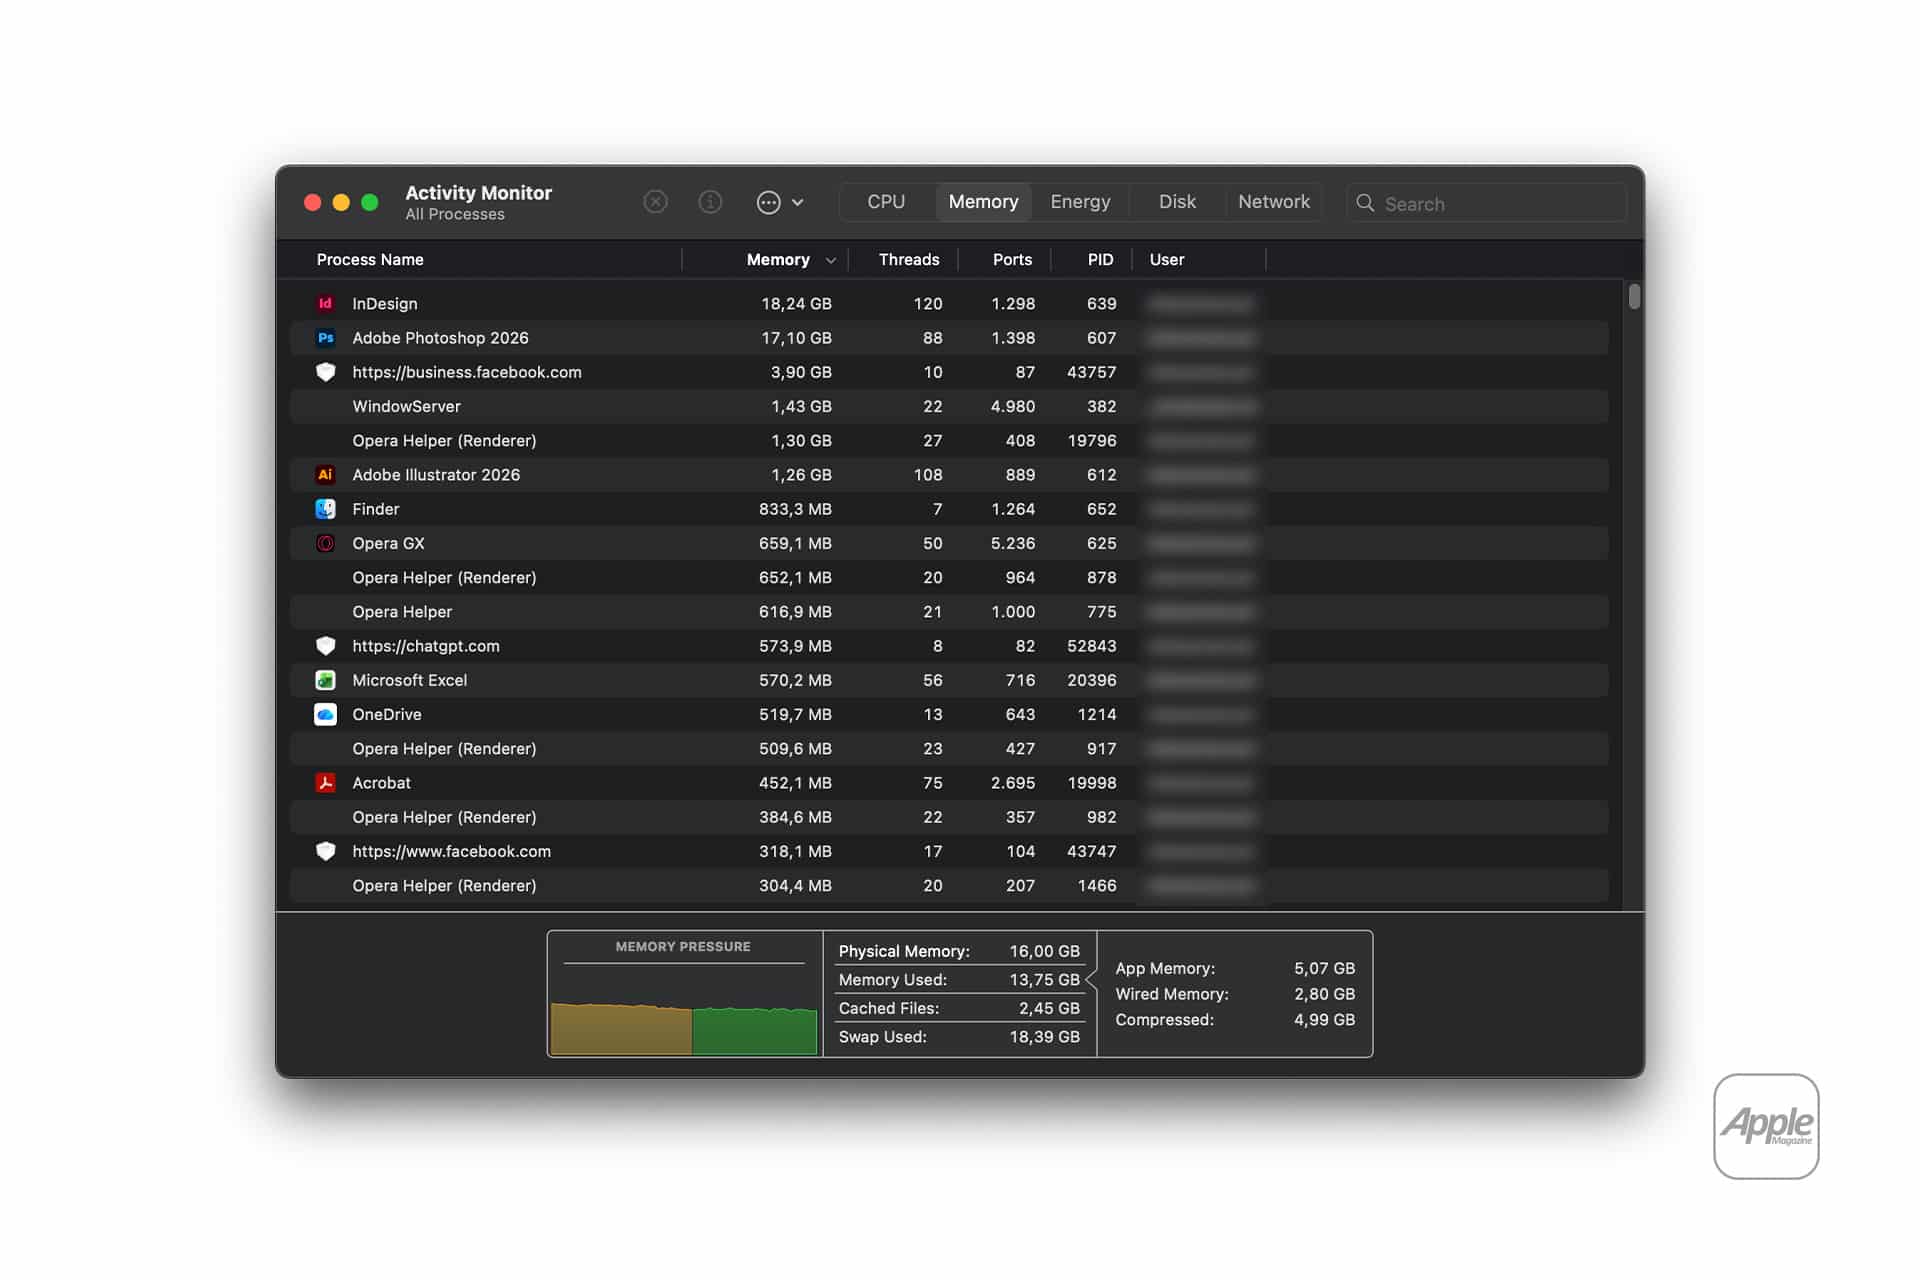
The Memory Tab Is About Pressure, Not Empty RAM
Memory is one of the most misunderstood parts of Mac performance. A Mac using a lot of memory is not automatically in trouble. macOS is designed to use available RAM efficiently, including caching data to make apps and files open faster. Empty memory is not always better memory.
The more useful indicator is Memory Pressure, shown at the bottom of the Memory tab. Apple describes it as a graph showing how efficiently memory is serving processing needs. Green indicates the Mac is using memory efficiently. Yellow suggests the Mac might eventually need more RAM. Red indicates the Mac needs more RAM.
On Apple silicon Macs, memory is unified, which means CPU, GPU, and other parts of the system share one pool of high-speed memory. That design is efficient, but it also means choosing enough memory at purchase is significant because it cannot be upgraded later. Activity Monitor can help determine whether a Mac is consistently operating under memory pressure.
A browser with many tabs, professional creative apps, virtual machines, large spreadsheets, photo libraries, music production tools, development environments, and AI-related workflows can all increase memory use. The Memory tab helps show whether the problem comes from one app, several apps together, or a workload that is larger than the Mac’s available memory.
To view memory pressure:
Activity Monitor > Memory > Memory Pressure graph
The columns also matter. Memory shows how much RAM each process is using. Compressed Memory shows memory compressed by macOS to reduce pressure. Swap Used shows how much data has been moved between memory and storage. Some swap usage can be normal. Heavy swap usage combined with yellow or red memory pressure can explain slowdowns, especially when several demanding apps are open.
The practical response is simple. Close apps and browser tabs that are not needed. Restart apps that appear to be leaking memory. Update apps that repeatedly consume excessive memory. Restart the Mac if the system has been running for a long time and behavior feels unusual. For future purchases, consistent memory pressure is a sign that a higher-memory configuration may be worth considering.
The Energy Tab Helps Explain Battery Drain
The Energy tab is especially useful on MacBook Air and MacBook Pro. It shows which apps are using the most energy and which ones may be preventing sleep or affecting battery life. Apple’s guide describes the Energy pane as a way to monitor overall energy use and see details for each app.
Energy Impact is a short-term measure of how much energy an app is using. 12 hr Power shows longer-term use. Preventing Sleep shows whether an app is keeping the Mac awake. App Nap indicates whether macOS can reduce the activity of apps that are not actively being used.
This view is useful because battery drain is not always caused by the app in front. A cloud backup, browser extension, sync service, video call app, media encoder, or background updater may be using power even when it is not the main focus. Activity Monitor can reveal those patterns.
To view energy use:
Activity Monitor > Energy
The Energy tab is also a good place to check after installing a new app. If battery life suddenly becomes worse and one process appears consistently high, the app may be running tasks in the background. That does not make the app bad, but it may need settings changes. A cloud storage app may be syncing. A messaging app may be indexing messages. A browser may be running an active tab. A video app may be decoding or uploading files.
MacBook users can pair Activity Monitor with Battery settings when diagnosing battery issues. Activity Monitor shows app behavior in more detail, while Battery settings show system-level power options and recent usage.
To check Battery settings on Mac:
Apple menu > System Settings > Battery
The goal is not to eliminate every energy-using process. A Mac doing useful work will use power. The point is to identify unexpected activity, especially when running on battery or when the Mac should be idle.
The Disk Tab Shows Hidden File Activity
The Disk tab shows how much data processes are reading from and writing to storage. This is useful when a Mac feels slow during file-heavy work, when storage activity seems constant, or when an app is moving large amounts of data in the background.
Disk activity can come from many normal tasks. Photos may analyze or sync a library. Spotlight may index files. Time Machine may prepare backups. iCloud Drive may download or upload files. A video editor may generate cache files. A browser may download updates. macOS may write virtual memory data if memory pressure is high.
To view disk activity:
Activity Monitor > Disk
The Disk tab can help separate a slow app from a busy system. If the Mac slows down while one process is writing large amounts of data, the issue may be storage activity rather than CPU. That can happen during backup, sync, export, installation, or indexing.
Disk writes also matter for limited storage. If a Mac is almost full, performance can suffer because macOS needs free space for temporary files, updates, caches, and swap. Activity Monitor does not replace Storage settings, but it can reveal which processes are creating activity at a given moment.
To check Mac storage:
Apple menu > System Settings > General > Storage
A full disk can make other problems worse. If memory pressure is high and macOS needs swap space, low storage can create additional slowdowns. If apps are writing cache files and the disk is nearly full, errors or delays may appear. Activity Monitor helps show the activity, while Storage settings helps show capacity.
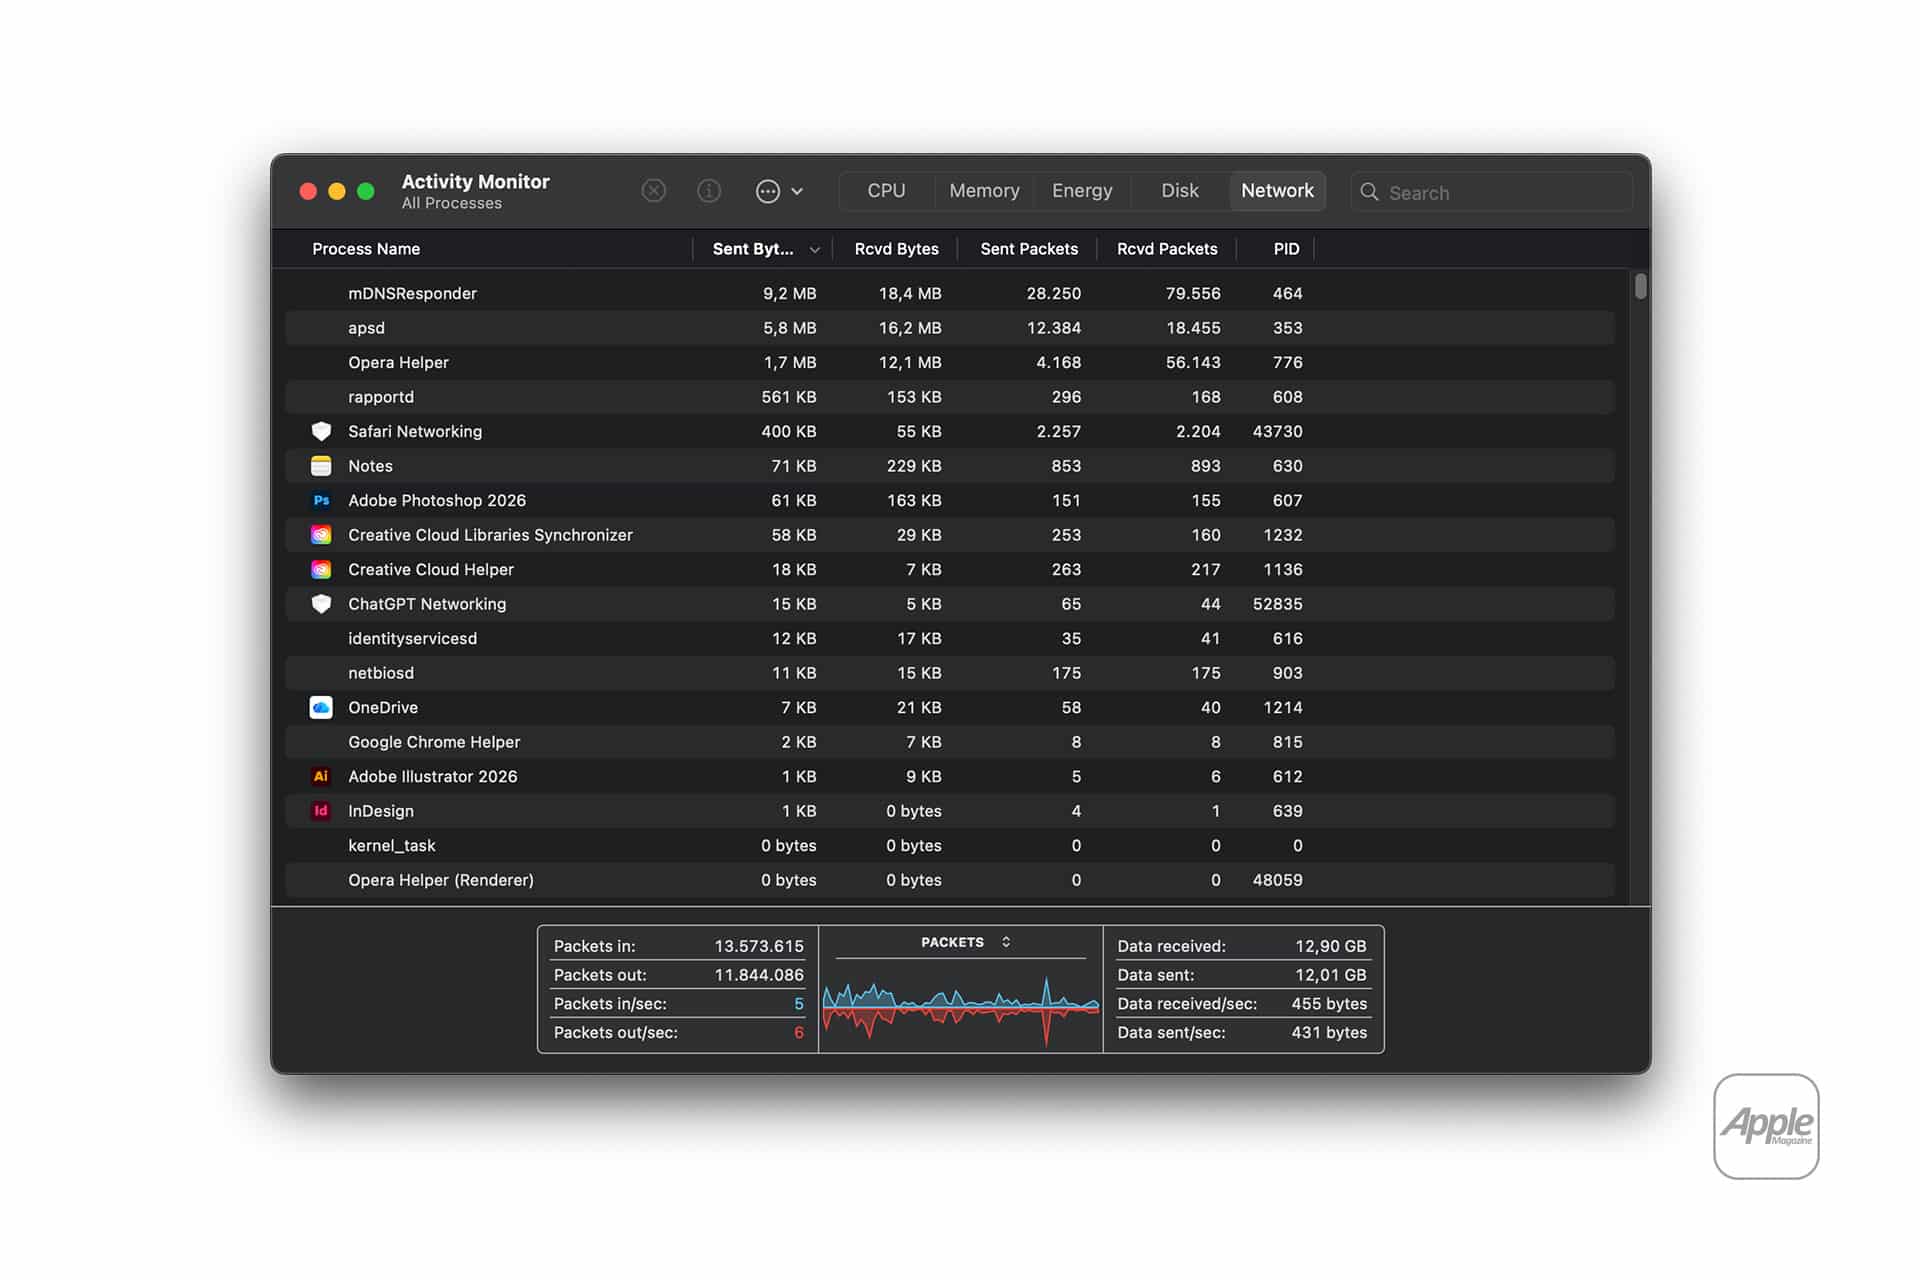
The Network Tab Reveals Data Movement
The Network tab shows data sent and received by each process. It can help identify apps using the internet, cloud services syncing in the background, or processes transferring more data than expected. Apple’s guide notes that the graph can display packets or data, depending on the selected view.
To view network activity:
Activity Monitor > Network
To switch the network graph between packets and data:
Activity Monitor > Network > Pop-up menu above the graph > Packets or Data
This tab is useful when a connection feels slow or when the Mac seems to be uploading or downloading without an obvious reason. A file sync service, browser tab, video call, software update, cloud photo library, messaging app, or backup tool may be active. Sorting by Sent Bytes or Rcvd Bytes can show which processes have moved the most data during the current monitoring period.
The Network tab is not a full privacy or firewall tool. It does not explain every destination, connection, or security detail in the way specialized network tools can. But it gives a readable first view. If an app is moving a large amount of data, Activity Monitor can show that it is active.
This can also help during travel or hotspot use. A Mac connected to a phone hotspot can consume data quickly if cloud sync, software updates, or streaming apps are active. Activity Monitor can help identify data-heavy processes before a limited mobile plan is drained.
Changing How Often Activity Monitor Updates
By default, Activity Monitor updates its information every few seconds. Apple says the default is every five seconds, but users can choose a faster update frequency for more precise monitoring. A faster refresh can be useful during troubleshooting, though Apple notes that increasing the update frequency may affect system performance.
To change Activity Monitor update frequency:
Activity Monitor > View > Update Frequency > Choose an update interval
A faster update is useful when checking a short spike, such as launching an app, starting a video export, opening a large file, or connecting to a network service. For normal use, the default is usually enough. Leaving Activity Monitor running with a very fast update interval is not necessary for most users.
Activity Monitor is best used as an investigative tool rather than a permanent source of anxiety. It is easy to see technical numbers and assume something is wrong. Many processes are normal. macOS handles indexing, syncing, caching, memory compression, background updates, cloud activity, and system services throughout the day. The data becomes useful when tied to a real problem: heat, slowdown, battery drain, freezing, network use, or storage pressure.
A Better Way to Troubleshoot Mac Performance
The strongest reason to learn Activity Monitor is that it creates a more disciplined way to diagnose problems. Instead of guessing, a Mac owner can check the relevant tab.
If the Mac is hot or sluggish, check CPU. If apps are slowing down with many windows open, check Memory. If the battery is falling quickly, check Energy. If files, backups, or exports feel stuck, check Disk. If internet activity seems unusual, check Network. That pattern is simple enough to remember and detailed enough to be useful.
Activity Monitor also helps avoid unnecessary fixes. A slow Mac does not always need a restart, a reinstall, a cleaner app, or a new computer. Sometimes one browser tab is stuck. Sometimes one app is indexing. Sometimes a sync service is catching up. Sometimes memory pressure is high because too many demanding apps are open. Sometimes the system is busy for a normal reason and will settle down.
At the same time, Activity Monitor can reveal when a bigger issue exists. Red memory pressure, constant swap use, repeated high CPU from one app, heavy disk writes with little free storage, or persistent network activity from an unfamiliar process may deserve more attention. The tool does not solve every problem, but it shows where to look next.
The app remains one of macOS’s most useful built-in utilities because it respects the Mac’s deeper nature. A Mac is simple on the surface, but many processes are always running underneath. Activity Monitor makes that hidden layer visible without requiring third-party software.
For most Mac owners, the best use is occasional. Open it when the Mac behaves differently. Sort the relevant tab. Look for sustained activity rather than one-second spikes. Quit only what is safe to quit. Update problematic apps. Check storage and battery settings when needed. Activity Monitor will not make every performance problem disappear, but it can turn confusion into evidence.